

Key points
- Bitcoin’s price has historically followed a four-year cycle aligned with halving events.
- Bitcoin peaked in October 2025, 534 days after the 2024 halving, in line with the previous two cycles.
- The fall since has been the smallest of any cycle so far: 54%, against 77% to 87% in earlier bear markets.
- Institutional capital and a reduced supply shock at each halving are changing the dynamics of bitcoin’s price.
- Supporters of the four-year cycle say the same timeline is repeating.
- Proponents of a longer bitcoin cycle cite global liquidity and demographic changes as key reasons why the cryptocurrency’s gains will extend beyond a four-year timeframe.
Since bitcoin launched in 2009, its price has followed a four-year cycle, largely driven by retail activity. Every four years, following bitcoin's halving event, which cuts new supply by 50%, a steep bull run typically occurs. Each bull run so far has been followed by a fall of 77% to 87% over roughly the next year. Unlike previous cycles, institutional money and macro correlation lowered bitcoin’s volatility since the last cycle low in November 2022.
The changes to the cryptocurrency ecosystem raise the question: Is bitcoin’s four-year cycle broken? There are compelling cases for either side of the argument, and we explore these below. Keep reading to learn more.
- Bitcoin’s 4-year cycle in 2026: on time, but smaller
- Bitcoin cycle dates: halvings, peaks and lows
- What were the gains in previous bitcoin cycles?
- What has changed bitcoin’s four-year cycle?
- Does the current global macro environment mean bitcoin’s four-year cycle is intact?
- What does a five-year cycle mean for bitcoin?
- Is bitcoin’s 4-year cycle over? It’s unclear.
- Bitcoin four-year cycle FAQs
- Start building your crypto portfolio with Caleb & Brown
Bitcoin’s 4-year cycle in 2026: on time, but smaller
So far, the current cycle has kept to the old timetable, but its moves have been smaller.
- The peak came on time. Bitcoin peaked at US$126,272 on October 6, 2025, 534 days after the April 2024 halving. The two previous peaks came 526 days (2017) and 548 days (2021) after their halvings.
- The fall has been the smallest yet. Bitcoin then fell 54% to its lowest point so far, on July 1, 2026. Earlier bear markets fell 77% to 87%.
- The low came sooner. That low came 268 days after the peak. In earlier cycles, the lowest point came 363 to 410 days after the peak.
Whether July 2026 marked the bottom of this bear market will only be clear in hindsight. Past performance is not a reliable indicator of future performance.
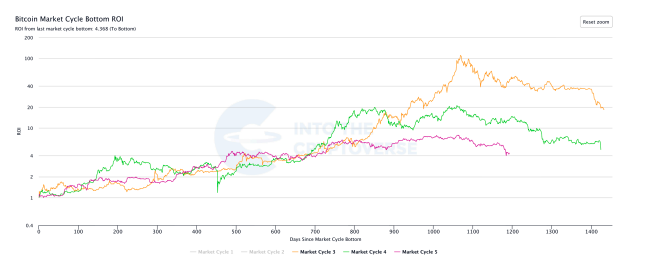
Every bitcoin bear market compared: what US$100 bought at each peak was worth at the lowest point.
Bitcoin cycle dates: halvings, peaks and lows
| Halving | Peak | Days to peak | Low (fall from peak) | Days to low |
|---|---|---|---|---|
| Nov 2012 | Nov 2013 | 367 | Jan 2015 (-87%) | 410 |
| Jul 2016 | Dec 2017 | 526 | Dec 2018 (-84%) | 363 |
| May 2020 | Nov 2021 | 548 | Nov 2022 (-77%) | 376 |
| Apr 2024 | Oct 2025 | 534 | Jul 2026 (-54%, lowest so far) | 268 |
Source: Bitstamp daily prices, intraday highs and lows. Days run from the halving to the peak, and from the peak to the low. See all four phases of each cycle on our bitcoin market cycle chart.
What were the gains in previous bitcoin cycles?
Bitcoin’s previous four-year cycles have seen the cryptocurrency make strong gains then steep losses. The gains and losses were:
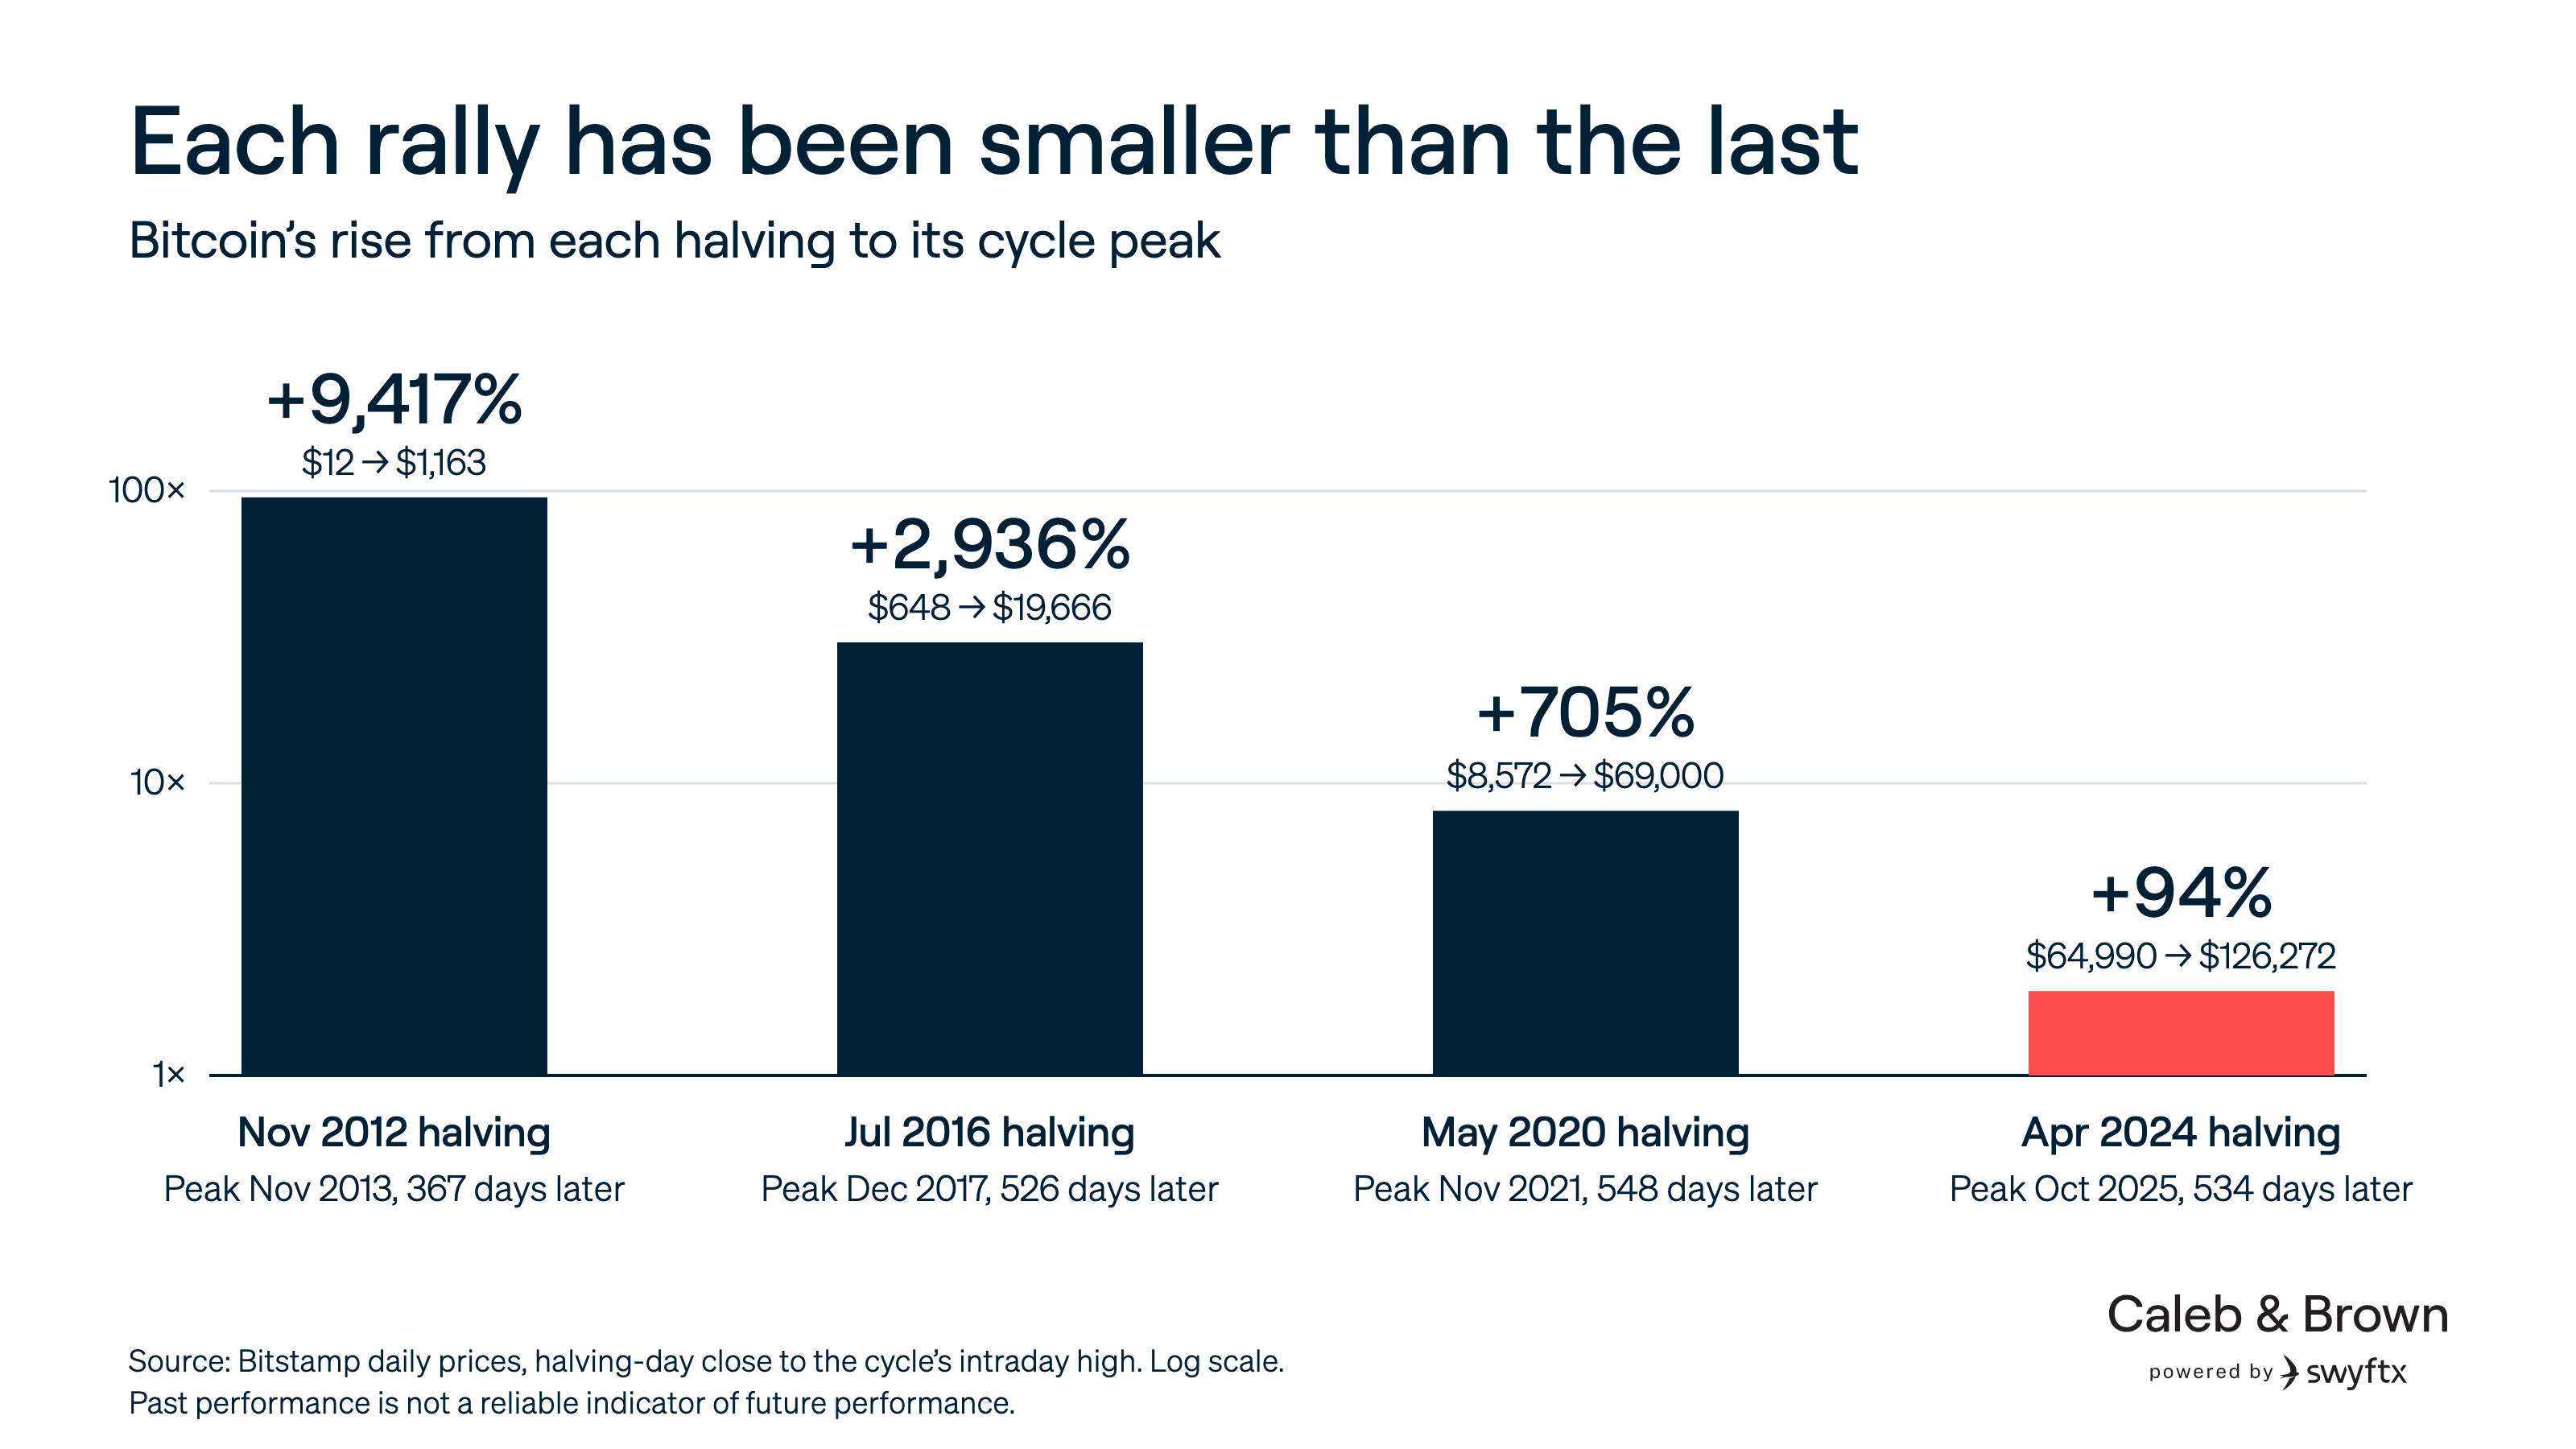
- 2012: from about US$12 at the halving to US$1,163, before dropping 87%
- 2016: US$650 to US$19,666, and then crashed 84%
- 2020: from US$8,700 to US$69,000, and then a 77% correction
- 2022: cycle low of US$15,479 to US$126,272 (+716%), then a 54% fall to the lowest point so far, on July 1, 2026
The current cycle saw bitcoin rally to a new all-time high (ATH) of US$126,272 on October 6, 2025, 534 days after the last halving on April 20, 2024. From the halving to that ATH, bitcoin’s price almost doubled, a much smaller post-halving rally than in previous cycles, as increased adoption and institutional capital lowered bitcoin’s volatility.
What has changed bitcoin’s four-year cycle?
Three months before the April 2024 halving, bitcoin spot exchange-traded funds (ETFs) started trading on January 11. The entrance of institutional capital into the market has potentially caused steadier price movements, both to the upside and downside, compared to previous cycles that were characterised by a blow-off top. While this “blow-off top” scenario may still occur this cycle, proponents of bitcoin’s four-year cycle breaking indicate that the asset may no longer experience significant swings anymore, particularly to the upside.
Another key difference this cycle, compared to previous cycles, is that a new all-time high was reached before the April 2024 halving as institutional demand potentially tempers the large swings typical of retail trading in earlier cycles.
Before institutional capital entered crypto, the previous bitcoin cycles followed a similar timetable. The time from the cycle low to the cycle high was typically around 1,060 days, while the time from the cycle high to the next low was around 370 days. The timing between bitcoin’s previous cycle lows and highs is outlined below.
| Cycle dates | Market | Count (days) |
|---|---|---|
| Cycle low Jan 14, 2015 → ATH Dec 17, 2017 | Bull | 1,068 |
| ATH Dec 17, 2017 → Cycle Low Dec 15, 2018 | Bear | 363 |
| Cycle Low Dec 15, 2018 → ATH Nov 10, 2021 | Bull | 1,061 |
| ATH Nov 10, 2021 → Cycle Low Nov 21, 2022 | Bear | 376 |
| Cycle Low Nov 21, 2022 → ATH Oct 6, 2025 | Bull | 1,050 |
| ATH Oct 6, 2025 → Low so far Jul 1, 2026 | Bear (so far) | 268 |
Source: Bitstamp daily prices
Assuming the time from the October 6, 2025 ATH to the recent declines was the beginning of a bear market, there could be approximately 220 further days (to mid-October 2026) of potential downside before bitcoin’s price bottoms.
Importantly, this scenario relies only on the average length of each bull and bear market, and there are several other factors influencing bitcoin’s price. These factors are detailed in the following sections.
Institutional capital is making bitcoin less volatile
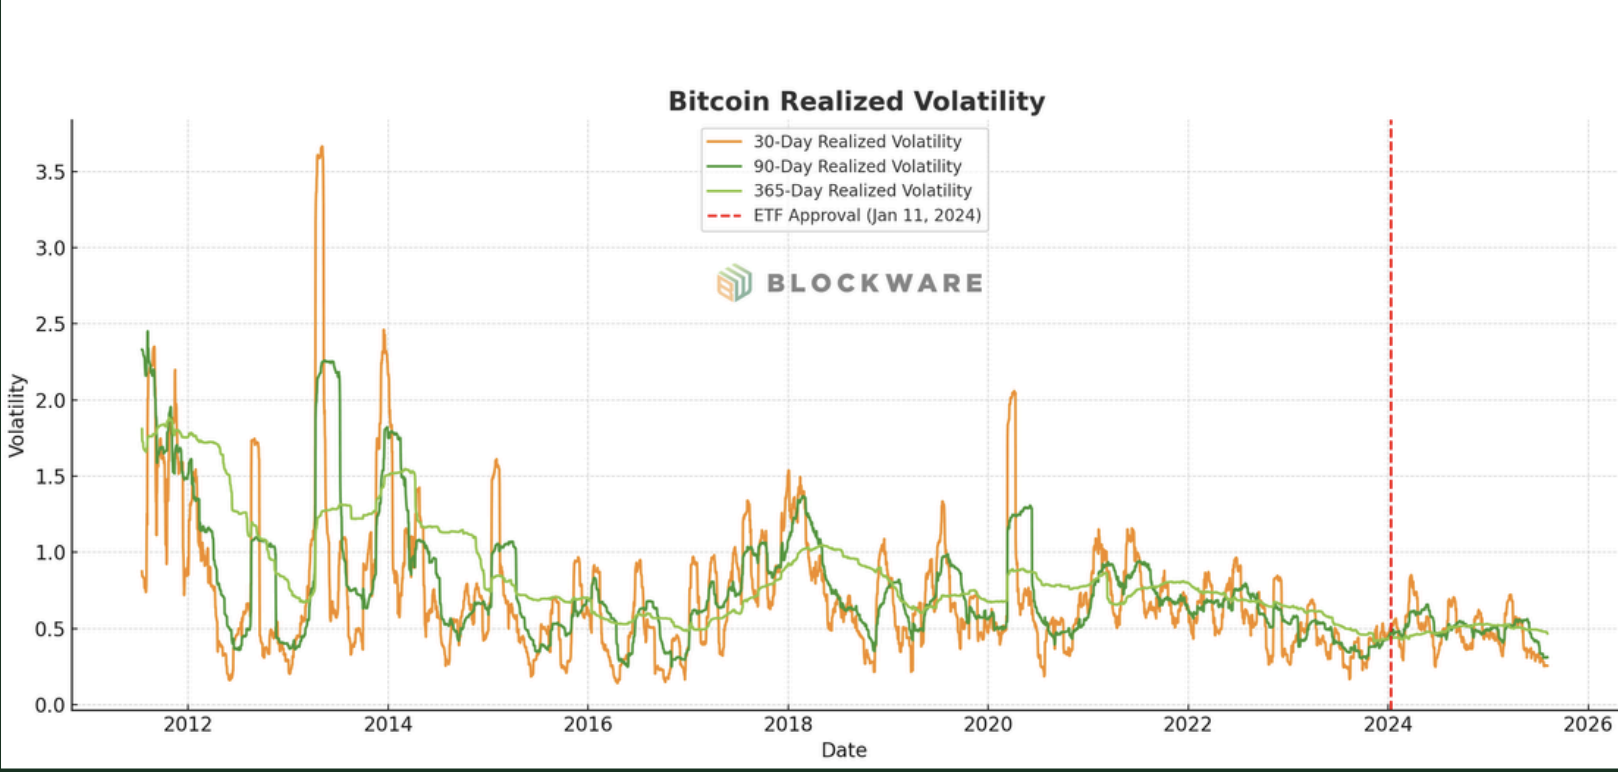
Before bitcoin ETFs launched, the cryptocurrency’s annualised realised volatility typically exceeded 150%. Since January 2024, bitcoin’s volatility has compressed, with spikes preceding profit-taking less violent, and drawdowns milder than previous cycles. Further, on-chain data demonstrates that in the post-ETF era, market participants take profit at lower multiples than previous cycles. In early 2026, the net unrealised profit/loss multiple had ranged between 45% and 65%, meaning dips were bought quickly and rallies were sold just as quickly.
Since the crypto sell-off that was exacerbated by the record liquidation event on October 10, when US$19 billion in leveraged positions were liquidated, bitcoin’s net unrealised profit/loss (NUPL) declined to 19% as of late-February 2026. A high NUPL over 50% indicates that the market is in a greed-driven peak, while a low NUPL indicates fear or capitulation. The declining NUPL from the October all-time high supports the thesis that the four-year cycle is still intact.
Global macro has become more influential on bitcoin’s price
Previous bitcoin halvings saw supply drastically reduce, which caused a larger degree of scarcity than the most-recent halving. In the 2024 halving, bitcoin’s supply reduced to 0.85% from 1.7%. Further, almost 94% of all bitcoin has been mined, meaning that the supply shock becomes more subdued with each halving.
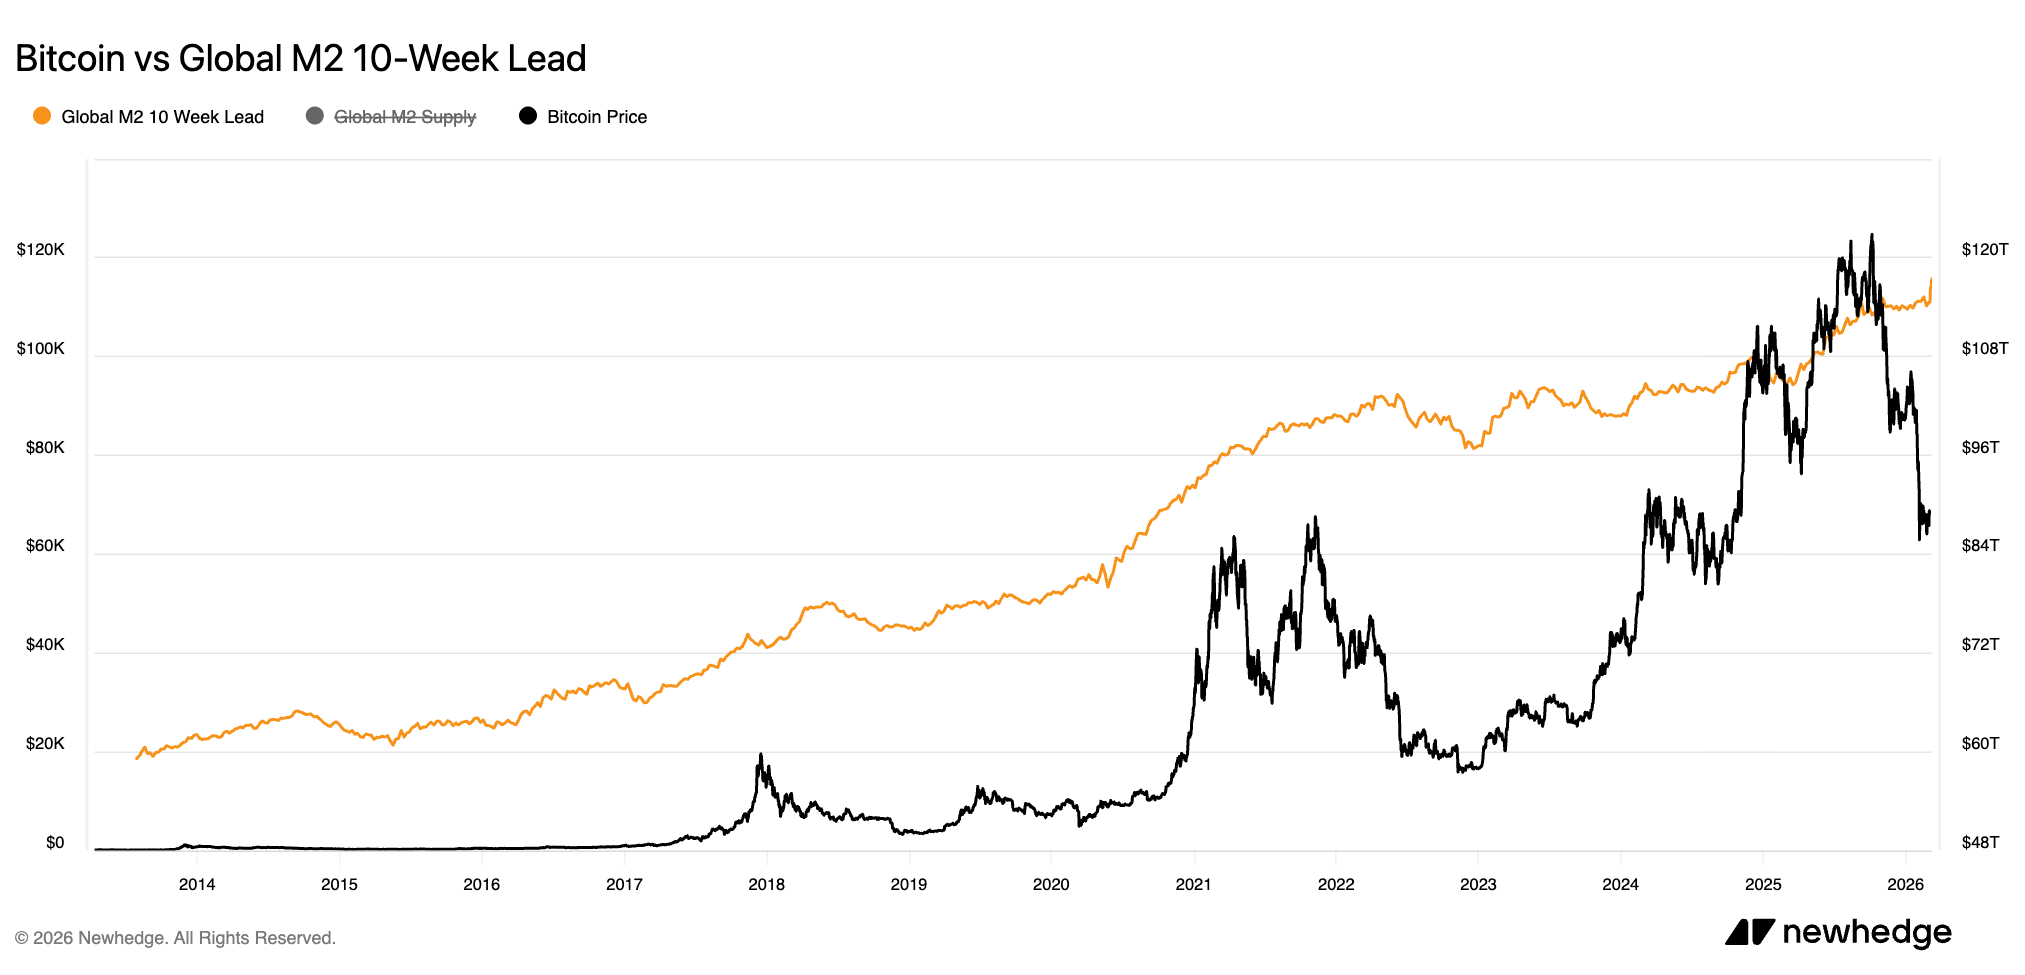
Like other risk assets, bitcoin has become correlated with the global M2 money supply. Throughout 2022, when central banks were raising interest rates to curb inflation, bitcoin declined along with other risk assets. And as global liquidity began to grow again from 2023 to 2025, bitcoin’s price appreciated.
Market participants will presumably be closely watching the U.S. Federal Reserve's monetary policy agenda throughout the remainder of 2026, especially as quantitative tightening ended in December 2025. While liquidity won’t immediately spike, monitoring how risk assets and bitcoin respond to the adjustment in monetary policy will provide an indication of whether bitcoin continues selling off to a low in late 2026, which would align with the four-year cycle remaining intact.
Does the current global macro environment mean bitcoin’s four-year cycle is intact?
Historically, the year that follows bitcoin’s post-halving peak is characterised by compression, lower volatility expansion and declining year-to-date returns. Further, in mid-term election years, like 2014, 2018 and 2022, and late-cycle environments, bitcoin has led weakness in risk assets. It wasn’t until TradFi markets exhibited further weakness that liquidity conditions meaningfully changed, aligning with the view that risk assets like bitcoin and crypto could see upward momentum in the long term, but the right monetary policy conditions have to prevail. And those conditions require policymakers to be satisfied that substantive measures must be taken, meaning a sustained sell-off across TradFi risk assets driven by persistent economic weakness. If bitcoin and other risk assets continue to decline throughout 2026 until central banks implement quantitative easing and other measures to boost liquidity, then it would be clear that bitcoin’s four-year cycle is not broken.
It’s also important to note that bitcoin’s October 2025 all-time high wasn’t accompanied by euphoria and a broader altseason. This means the downside following the peak may also be subdued. Market participants could expect slower declines, reduced speculation and longer periods of consolidation before the trend materially changes. And with the return on investment declining with each market cycle, plus Wall Street’s involvement in offering exposure to bitcoin, future rallies could be more subdued, too. Though, when compared to TradFi’s year-on-year performance, bitcoin’s previous market cycles still far outperform the major U.S. indexes.
Given there hasn’t been a clear catalyst for central banks to resume further interest rate cuts or quantitative easing, precious metals have maintained their relative strength and treasury yields have declined, the current picture in bitcoin and across crypto could indicate a late-cycle environment, where a bottom will be formed in the coming months and price (and sentiment) will turnaround when liquidity conditions ease. The charts below indicate that, while quantitative tightening ended in the U.S. in December 2025, monetary policy remains relatively restricted.
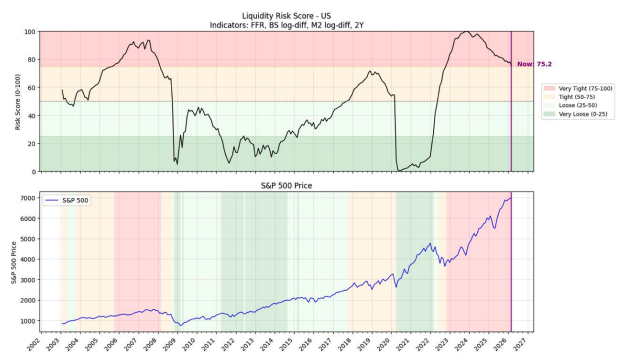
As the catalysts align to warrant lower interest rates and increased liquidity, risk assets, including crypto, may eventually attract the sustained capital flows required to see upward momentum.
What does a five-year cycle mean for bitcoin?
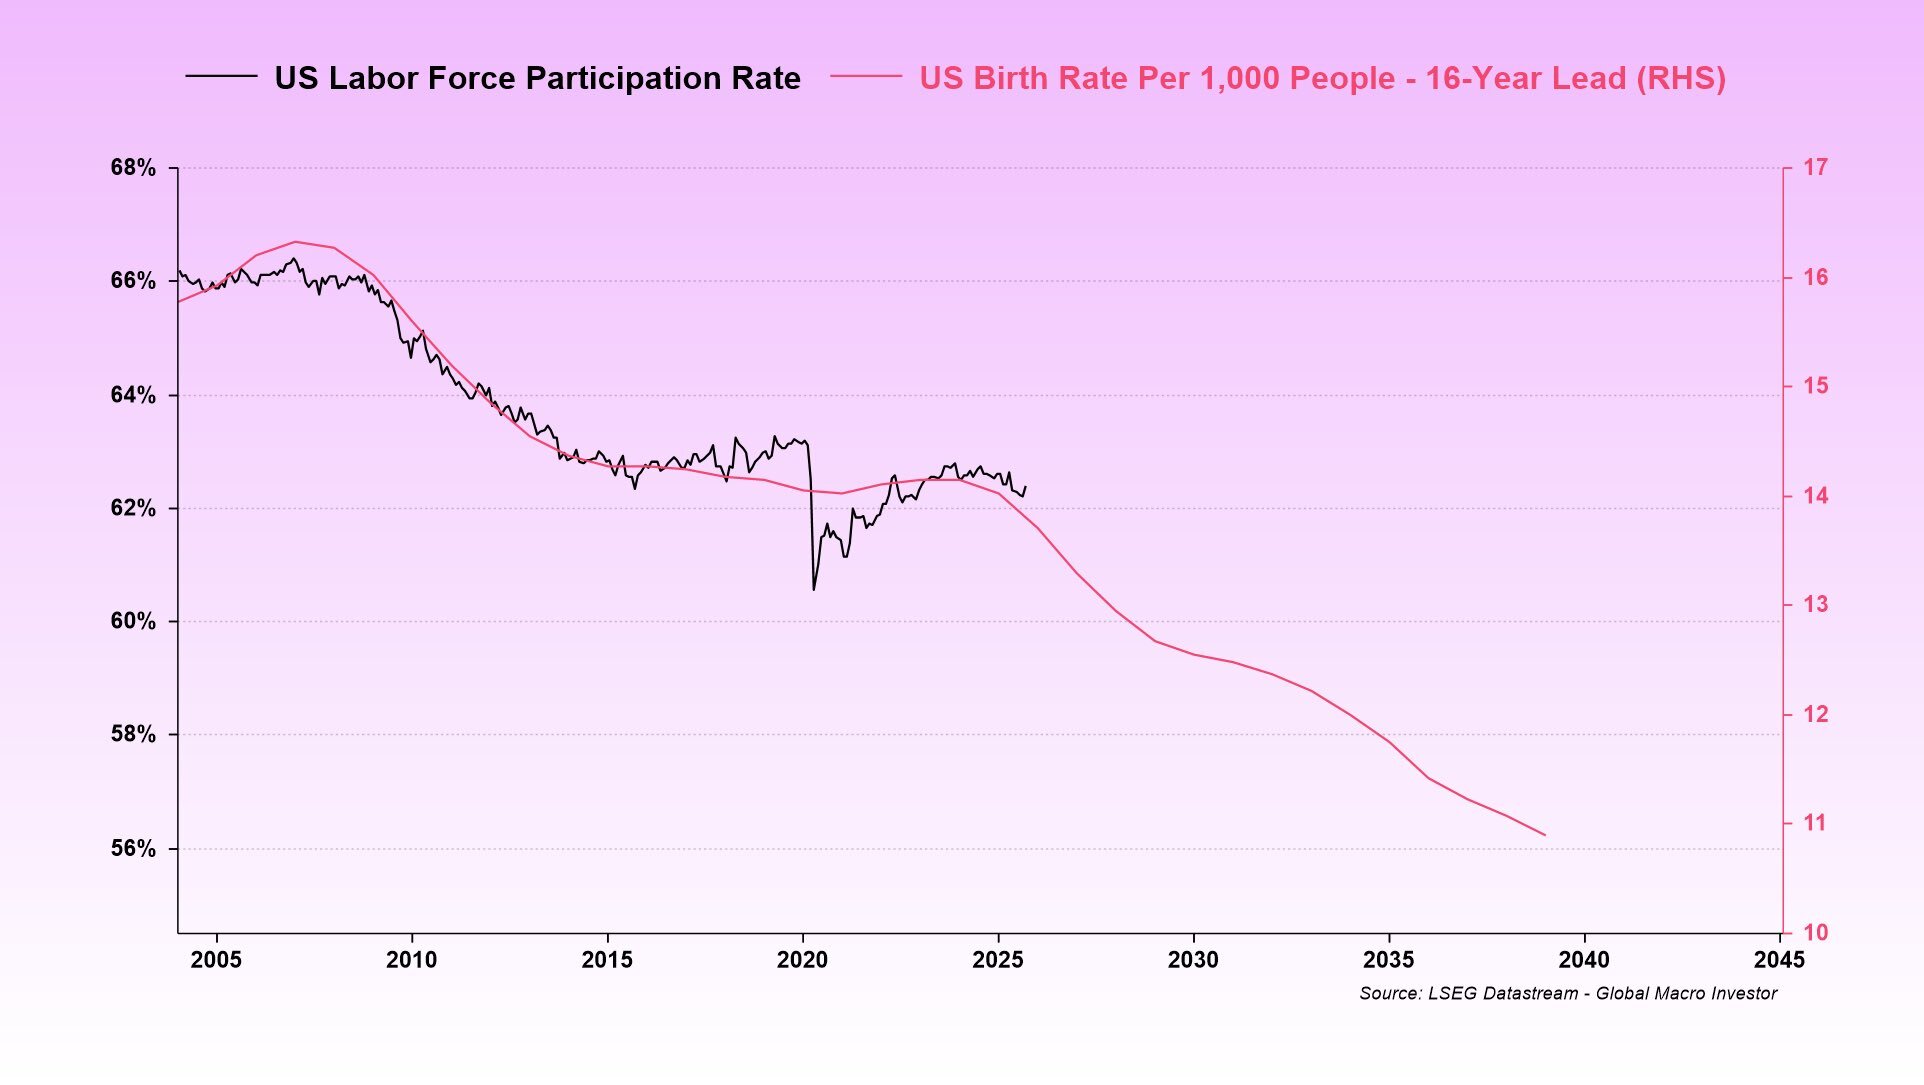
Proponents of bitcoin’s cycle extending beyond the four-year timetable cite macroeconomic factors, such as M2 money supply, demographic changes, and currency debasement, as the core reasons why bitcoin’s price movements more closely align with liquidity and business cycles. The central thesis of bitcoin’s cycle lining up with the business cycle is that, in the U.S., for example, the targeted growth rate of about 2% is used in its entirety to service debt repayments, which doesn’t fuel new growth. With the birth rate declining, population growth isn’t occurring fast enough to expand the labour force, and, in turn, fuel further economic expansion. In this sort of scenario, the central bank must stimulate growth through monetary policy measures such as quantitative easing (QE).
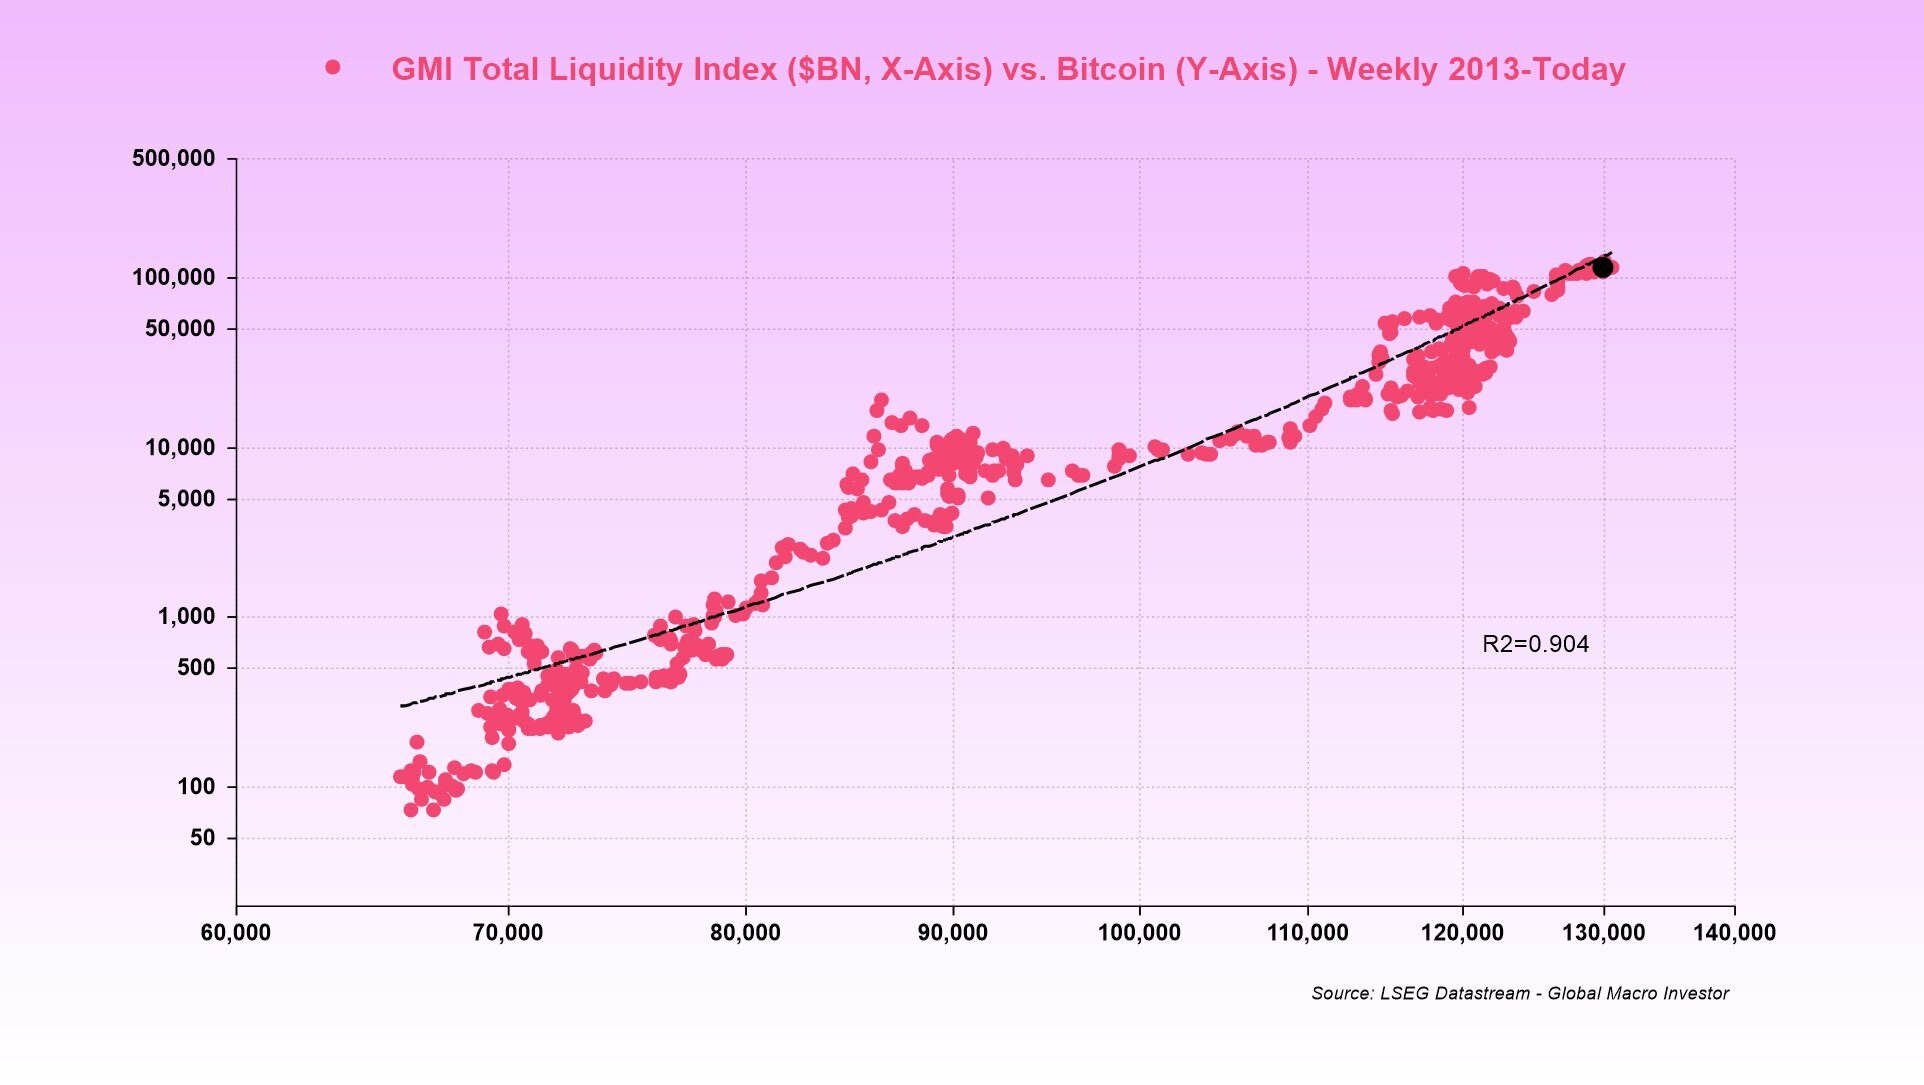
As outlined in the chart below, bitcoin’s price has remained largely in line with changes in global liquidity, suggesting that perhaps as global liquidity peaks, so will bitcoin’s price. However, market dynamics and bitcoin’s price as of March 2026 indicate that there will potentially need to be further downside for bitcoin and other risk assets before liquidity rises again. This scenario would mean the four-year cycle is intact as many assets would have seen sizable declines before sustained upward momentum returns.
While the additional liquidity provided through QE helps the government and corporations remain solvent, it devalues a currency’s purchasing power. Citizens can no longer accumulate cash savings or allocate capital to “safe” assets to plan for their retirement as interest rates on savings and more conservative assets end up with a negative growth rate. Instead, an increasing amount of capital needs to be allocated to riskier assets that have a better chance of outgrowing the rate at which the currency is debased.
For example, if inflation is 3%, while currency debasement is around 8%, then a person’s investments need to return at least 11% per year to maintain purchasing power. The S&P 500’s average return over a ten-year period is 10.5%. As companies, governments and individuals look for higher returns on their money, capital flows into riskier assets, such as crypto. This flow of capital aligns with the theory that bitcoin’s cycle will now extend as it matures. Its price will appreciate as global liquidity climbs, but it won’t experience the violent swings characteristic of previous retail-only cycles.
Is bitcoin’s 4-year cycle over? It’s unclear.
The cryptocurrency market has been trading for about 17 years, a relatively short time in the context of global financial markets. While the length of bull and bear markets has remained similar throughout previous bitcoin cycles, the entrance of institutional capital, macroeconomic correlation, and the reduced supply shock that comes with each bitcoin halving points to possible changes in bitcoin’s market structure.
It’s too soon to say whether the cycle has changed for good. The timing of the 2025 peak held: it came 534 days after the halving, in line with the last two cycles. The bear market since has been shallower than any before it, and its lowest point so far came sooner, which fits the view that institutional capital is damping bitcoin’s swings.
Keeping current market dynamics in mind when you are considering your crypto holdings is critical at any time in the market cycle. Plus, with a long time horizon, holding bitcoin for long-term returns and as a store of value can be more effective than aiming to pick the top or bottom with absolute precision (something even seasoned market experts rarely get right).
Bitcoin four-year cycle FAQs
What is bitcoin’s four-year cycle?
It’s the pattern bitcoin’s price has followed since 2012. About every four years, a halving cuts the reward for mining new bitcoin in half. In each cycle so far, the price peaked 12 to 18 months after the halving, then fell sharply for about a year before recovering.
Is the bitcoin 4-year cycle over?
It’s too early to say. The 2025 peak came 534 days after the 2024 halving, in line with 2017 (526 days) and 2021 (548 days), so the timing has held. The fall since has been much smaller than in past cycles, which is why some analysts argue the cycle is changing.
Is the four-year cycle real?
It has held for three full cycles, which is a small sample. Some analysts link it to the supply cut at each halving. Others say global liquidity and the business cycle explain the same moves.
How long do bitcoin bear markets last?
In the last three cycles, bitcoin took 363 to 410 days to fall from its peak to its low. In the current cycle, the lowest point so far came 268 days after the peak.
Has bitcoin bottomed in 2026?
Bitcoin’s lowest point so far in this cycle came on July 1, 2026, 54% below the October 2025 peak. Whether that was the bottom will only be clear in hindsight.
Start building your crypto portfolio with Caleb & Brown
You don’t have to be an expert on bitcoin's market cycle to trade the original and largest cryptocurrency.
Caleb & Brown is the world's leading crypto brokerage for beginner and advanced investors alike, with bitcoin and hundreds of other crypto assets readily available for your portfolio.
Our personalised broker service makes crypto investing simple. A dedicated member of our broker team is always on hand to guide you along the way, giving you the confidence you need to navigate the world of crypto. Not to mention key features such as:
- One flat, transparent fee
- 300+ crypto assets available to buy, sell, and swap
- 24/7 customer support
If you're ready to take the next step and invest, contact your crypto broker today.
Not yet a client? Sign up for your free consultation.
from Caleb & Brown Cryptocurrency Brokerage.
.webp?u=https%3A%2F%2Fimages.ctfassets.net%2F4ua9vnmkuhzj%2FuIaUbUNRbO1LdljRWKvoI%2Fd93965ff275cd47f8c19fcc71edcd42e%2FBitcoins_Market_Cycle_V3-01__1_.jpg&a=w%3D3840%26h%3D2160%26fm%3Dwebp%26q%3D80&cd=2023-02-21T06%3A17%3A39.793Z)

.webp?u=https%3A%2F%2Fimages.ctfassets.net%2F4ua9vnmkuhzj%2F7meVnT2vnQelBrt6W5yw73%2F8469fbdea8168e404fff363b35dd65a4%2FBitcoin_Halving-01__1_.jpg&a=w%3D3840%26h%3D2160%26fm%3Dwebp%26q%3D80&cd=2023-01-10T02%3A22%3A06.649Z)


